EthBar
Overview
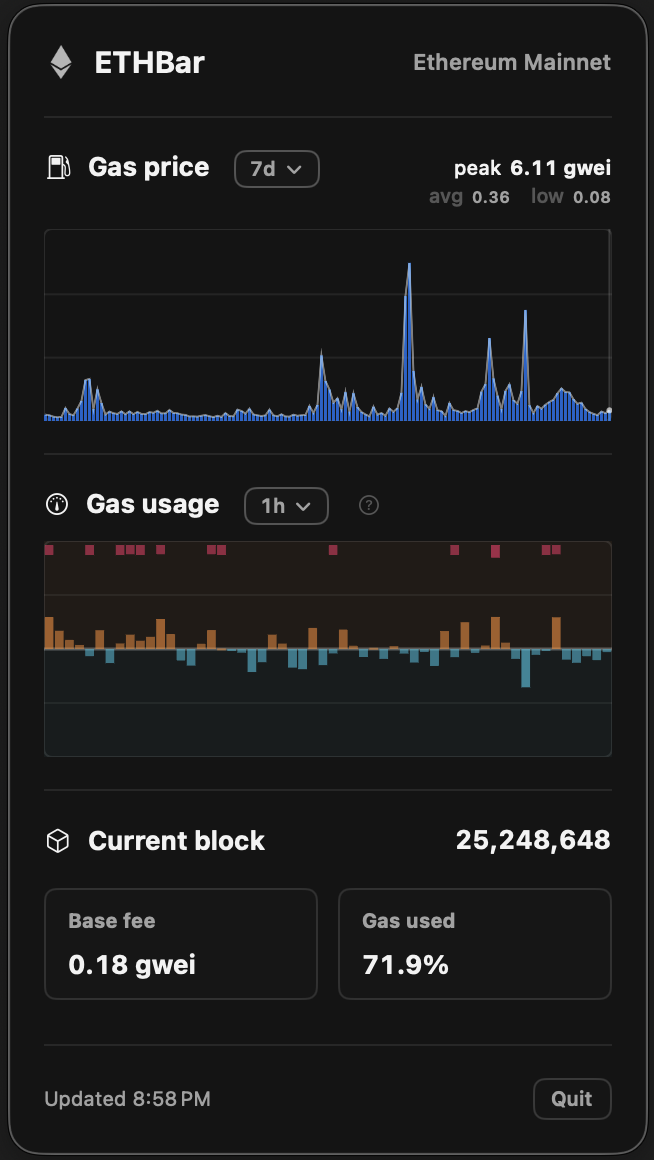
EthBar was my way of learning Swift and SwiftUI by building something useful. It is a native macOS menu bar app for keeping Ethereum Mainnet in view without leaving a dashboard open all day. The menu bar shows the live base fee, while the popover adds fee history, gas usage, the latest block, and the last update time.
The real challenge was fitting that information into a compact space without turning it into noise.
Interface Design
Large readouts show the current values, while the charts show how those values have changed over time. The time range controls the period shown, and the peak, average, and low summarize the data within that period.
The goal was information density without over-complexity. EthBar uses hierarchy, position, and colour to keep several layers of context readable at a glance.
The gas usage chart is the clearest example. Instead of starting at zero, it centres each bar on Ethereum’s 50% usage target. A block at 65% rises 15 points above the line in orange, while a block at 45% falls 5 points below it in blue. This makes both the direction and size of the difference easy to read in a small graph. At wider time ranges, each bar shows the average for a given group of blocks. Red blocks flag usage above 90%, and hovering reveals the exact values.
Data pipeline
The interface is small, but its charts still need enough history to be useful. On launch, EthBar loads its local cache, fills in any missing blocks through HTTP JSON-RPC, and then switches to a WebSocket newHeads subscription as new blocks arrive. The SwiftUI views observe that shared state and update the menu-bar title, charts, and current-block summary.
The cache keeps up to 50,400 blocks—roughly seven days of history. It is isolated behind a Swift actor, deduplicates blocks, merges them in order, and writes the resulting JSON atomically. That gives the app something meaningful to show immediately while the live connection catches up.